2024+1.74%
9,166Employed residents
Resources
Public planning materials, economic and workforce snapshots, community findings, and resources supporting regional opportunity.
Community intelligence
Explore the organization landscape, workforce readiness, economic activity, employment base, wages, and capacity shaping our region.
Fayette County profile
A focused entry point to economic activity, employment, housing, mobility, agriculture, and development capacity.
Employed residents
Median household income
Median property value
Homeownership
Additional perspective
Employment grew from approximately 9.01K residents in 2023 to 9.17K in 2024.
Additional source: Data USA Fayette County profile, primarily drawing on U.S. Census Bureau ACS data. Resident-employment measures differ from employer-location job counts elsewhere on this page.
Live · Work · Play
Attainable housing, a competitive residential tax position, and an exceptional concentration of community assets make our region easier to call home—and easier to choose for the long term.
Regional comparison
Median annual property taxes paid on owner-occupied housing, shown in dollars.
Regional organization landscape
An aggregate view of organizations mapped for community outreach, partnership development, and regional planning.
Explore the inventory
Food service, lodging & hospitality · 45 organizations
Hospitality, dining, lodging, and related visitor-serving organizations.
Scope: This aggregate planning inventory supports outreach and collaboration; it is not a census of every organization operating in Fayette County.
Official economic indicators
A source-backed view of Fayette County’s economic output, employer base, labor market, agriculture, education, and connectivity.
Explore the indicators
Retail sales · $330.9M
Total retail sales reported for 2022.
Sources: U.S. Census Bureau, U.S. Bureau of Labor Statistics, BEA via the Federal Reserve, USDA Census of Agriculture, and Illinois IDES. Reporting periods differ; market-activity measures overlap and should not be added together.
Economic deep dive
Separate views preserve the meaning of each measure while making movement, scale, affordability, and investment easier to compare.
Gross domestic product
Current-dollar GDP, 2023 compared with 2024. Dollars shown in millions.
Source: U.S. BEA via FRED. Percent changes calculated from published current-dollar values.
Business & employment base
Sources: U.S. Census Bureau and U.S. BLS. Census County Business Patterns and BLS QCEW use different coverage definitions and periods.
Housing & real estate
A practical view of residential inventory, tenure, costs, household patterns, and recent construction activity.
Source: U.S. Census Bureau QuickFacts. Housing-unit estimates are for July 2025; other housing measures are 2020–2024 ACS estimates.
Housing units per household, using mixed-period headline estimates; directional context only.
Median owner value divided by median household income ($60,944).
Twelve months of median gross rent; utilities included where paid by renter.
Population & households
Decennial counts and annual estimates show the size of the resident base.
Source: U.S. Census Bureau.
Household economics
Source: U.S. Census Bureau, 2020–2024 estimates.
Agricultural economy
Source: 2022 USDA Census of Agriculture, Fayette County profile.
Regional opportunity
See how strategic location, infrastructure investment, community assets, quality of life, and coordinated leadership position our region for future growth.
Public-facing materials are organized here; internal bylaws and governance documents are not included.
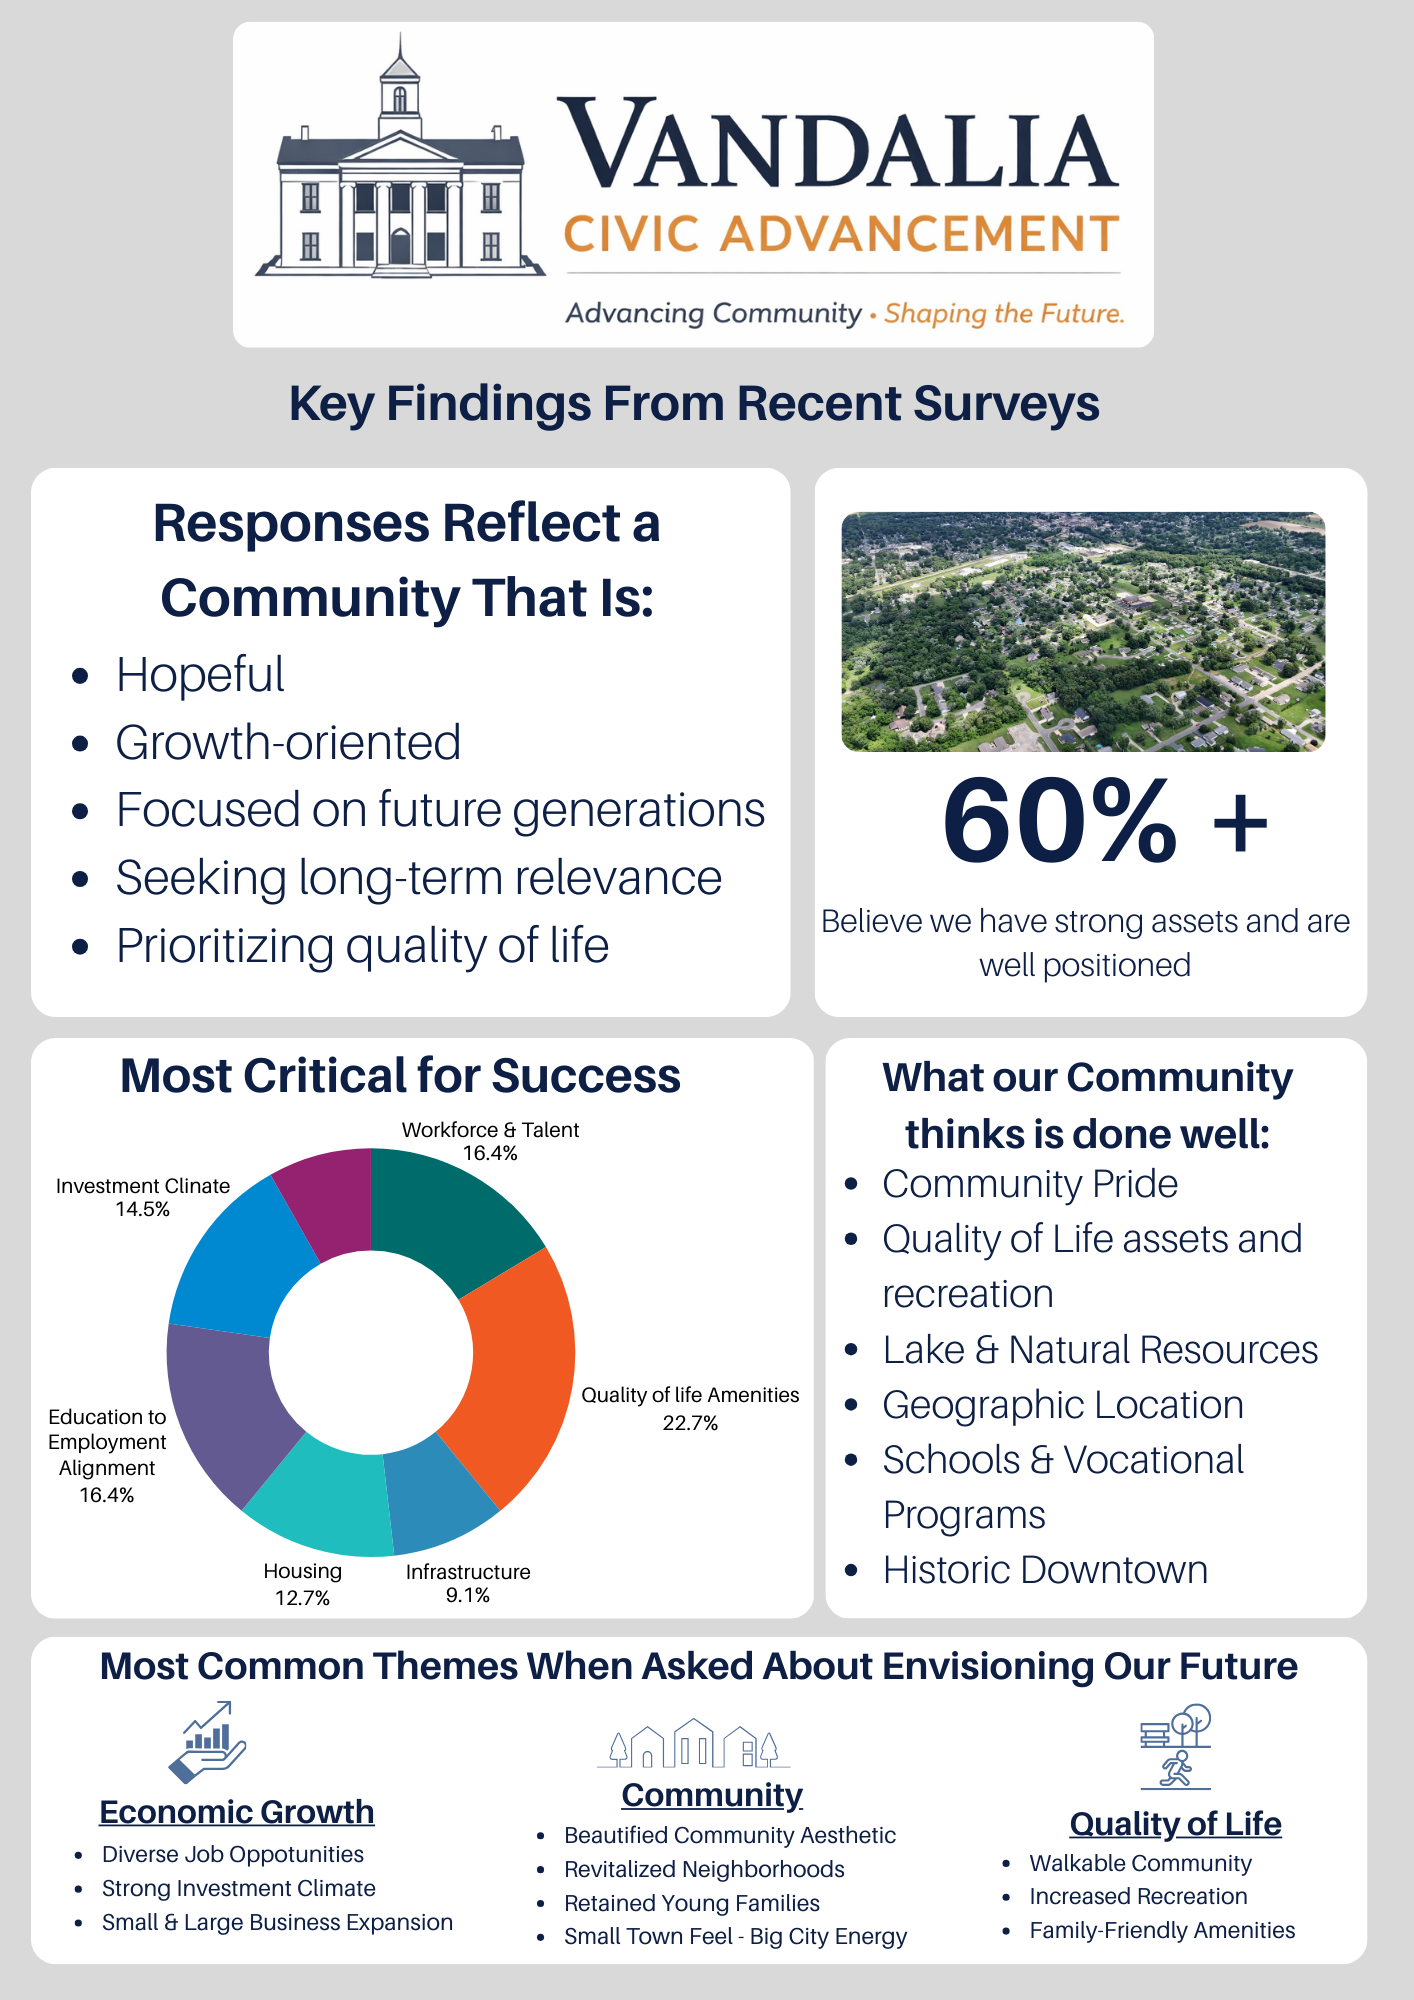
A visual summary of recent community input.
View resourceAn overview of VCAA’s vision, focus, and operating approach.
View resourcePublic release covering VCAA’s February 2026 relaunch.
View resourceLearn why membership matters and begin a conversation about participating.
Learn moreProgram overview, process, participation expectations, and answers from the Rural MAPPING facilitator.
View resourceThe State of Illinois awarded the City of Vandalia $3 million for road and water improvements serving 97 acres at Vandalia Industrial Park—advancing site readiness for future industrial investment and job opportunities.
Learn more